 Python
 PyTorch
 PyTorch Geometric
Overview
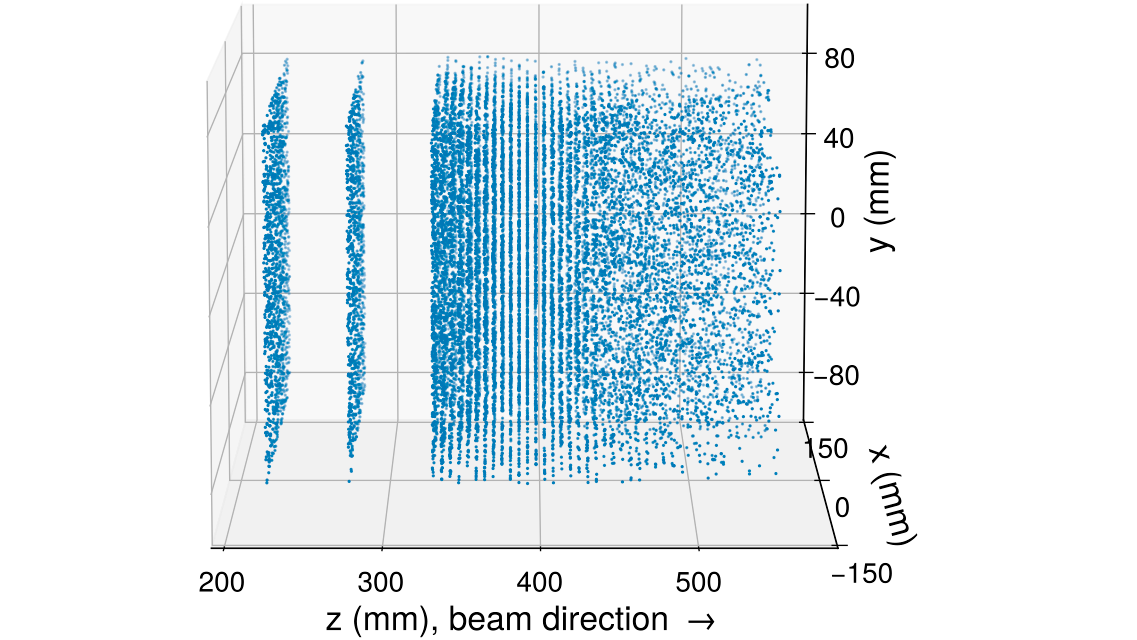
This prototype asks whether proton range can be predicted directly from the spatial pattern of detector hits. Instead of reducing each event to manually designed summary features, it represents the readout as a point cloud and lets a graph neural network learn relationships between nearby hits.
The experiment uses the same digital tracking calorimeter setting as the feature-based range-verification work, making it possible to compare a geometric deep-learning approach with the established pipeline.
Approach
- Detector hits become graph nodes with measured and spatial attributes.
- Graph edges capture local relationships in the detector point cloud.
- Models are trained and evaluated through a configuration-driven runner.
- Separate anthropomorphic phantoms provide training, validation, and held-out test data.
The repository contains configurations for point-cloud models and supports CPU and CUDA environments through PyTorch and PyTorch Geometric.
Outcome
The graph-based approach did not outperform the manually engineered feature pipeline. That negative result is still useful: it suggests that the strong physical structure encoded by the existing features is difficult to recover from detector hits alone with the tested architectures and data setup.
The code remains available as a documented research prototype so the approach, assumptions, and limitations can be inspected or extended rather than disappearing with an unsuccessful experiment.